
Filters
Total Spend
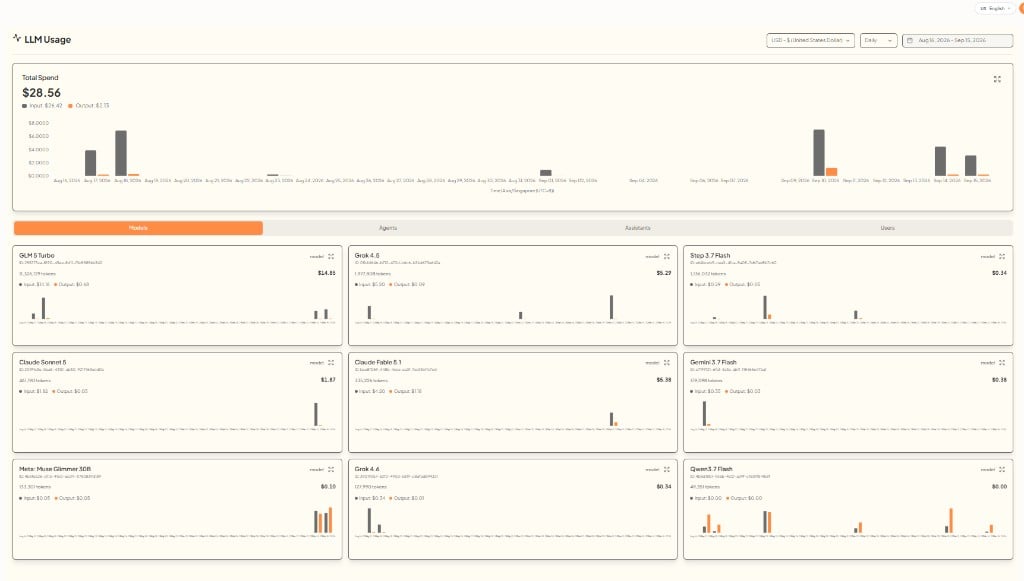
The top chart summarizes Total Spend for the selected period. Costs are split into Input and Output so you can see where usage is coming from.Breakdown tabs
Use the tabs below the chart to explore usage from different angles:
Click the expand icon on a chart or card to view it in more detail.